Subscriber Benefit
As a subscriber you can listen to articles at work, in the car, or while you work out. Subscribe Now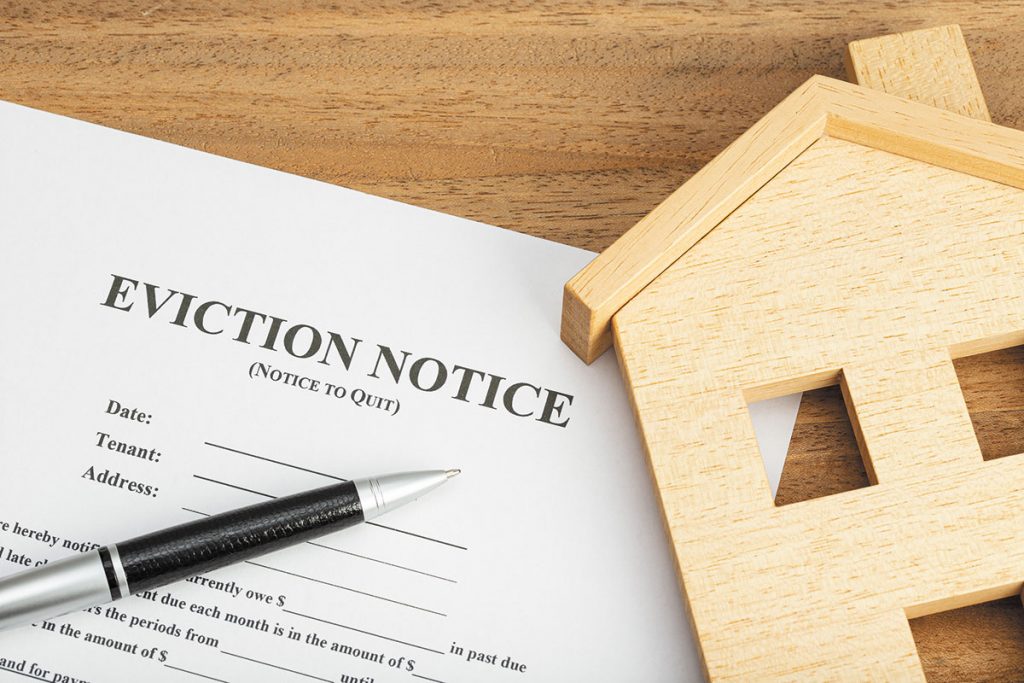
There are a lot of reasons for evictions in Indiana, with people struggling with unexpected bills, larger economic factors, low wages, health issues and other circumstances that impede their ability to pay rent.
SAVI, a program of The Polis Center, a research unit in the Indiana University Luddy School of Informatics, Computing, and Engineering at Indianapolis, hopes a new dashboard it’s developed will give people a look at comprehensive statewide eviction data and provide information that can be used to address housing issues.
SAVI is hosting a Dec. 7 event, “Empowering Indiana Communities with Evictions & Foreclosure Data,” where The Polis Center plans to unveil the new tool.
According to SAVI, the goal of the tool is to raise awareness about evictions in Indiana and provide a resource to empower communities to create change.

Marc McAleavey, The Polis Center’s community analysis program manager, said the hope is there will be future opportunities with the evictions dashboard to use its data to engage with state leaders on a policy level.
“I think the whole goal is get the tool out there and get folks thinking about it,” McAleavey said.
Partners in the SAVI project include WFYI Public Radio and New America, a “think and action” tank that focuses on equity at the center of its research and policy recommendations.
McAleavey said the partnership looked at several different eviction indicators around the state, with the intent of identifying conditions that led to high eviction rates.
He said the dashboard will have maps, eviction trends and some demographic data.
Work on the dashboard began in March, he said, with eviction data coming from the Indiana Supreme Court and demographic information taken from the U.S. Census and American Community Survey.
“I don’t know that many states that have a state dashboard of this variety,” McAleavey said.
The Polis Center issued a report in 2022, which found that each year, Indianapolis ranks among the highest cities in the country for the total number of eviction filings, trailing only New York and Detroit pre-pandemic.
“Indiana’s affordable housing prices and landlord friendly policies have made it an attractive place for large multifamily investors, and these companies file evictions at a startlingly high rate,” the report stated.

Matthew Dietrich, a senior research data analyst at the center, said in 2021, there were 50,505 eviction filings in Indiana. That number grew to 68,882 in 2022 and stands at 61,935 so far this year. There were 19,996 eviction judgments statewide in 2021, with that number rising to 27,680 in 2022 and currently at 23,250 through October of this year.
Dietrich said analysis of eviction data from Marion County has shown that, generally, a lot of the companies that had the most evictions at their properties were larger national housing corporations.
On a statewide level, there is a seasonality in evictions, with peaks generally occurring in the summer months, he added.
Overall, the evictions numbers are steadily creeping up in the state, Dietrich said.
“If it’s not back up to it, it’s pretty close to 2019, 2020 (levels),” he said.
Using the data

Andrew Thomas, a housing resource attorney at Indiana Legal Services’ Fort Wayne office, also said that, based on conversations he’s had with housing attorneys around the state, evictions are increasing in Indiana.
Thomas said some courts’ dockets are so full that a person can show up for an eviction hearing in the morning and end up waiting for their turn in court all day.
 He said the data from The Polis Center’s eviction dashboard will be useful because data varies from court to court.
“The more data we can collect, the more help we can provide people,” Thomas said.
If the kind of data mapping that he anticipates is available on the new tool, Thomas said it will help advocates across the state figure out where there are the most evictions in each county and try to work with apartment complexes, mobile home parks and other places with high eviction rates.
“This will be a helpful tool for housing advocates to determine what’s going on in communities,” he said.

Andrew Bradley, Prosperity Indiana’s policy director, said he is excited by the potential the Polis dashboard could bring to shedding light on Indiana’s housing affordability and stability crisis.
“It’s not just an urban problem. We see it in rural and suburban counties, as well,” Bradley said.
Trending up
Other eviction dashboards, like the one maintained by the Eviction Lab at Princeton University, track certain states and cities in the U.S. and provide ot general statistics.
Eviction Lab has been tracking weekly eviction filings since March 2020 in 34 cities and 10 states, including Indiana, to monitor the impact of the COVID-19 pandemic and associated policies.
According to Eviction Lab, there are 774,845 renter households in Indiana, paying a typical rent of $905 per month.
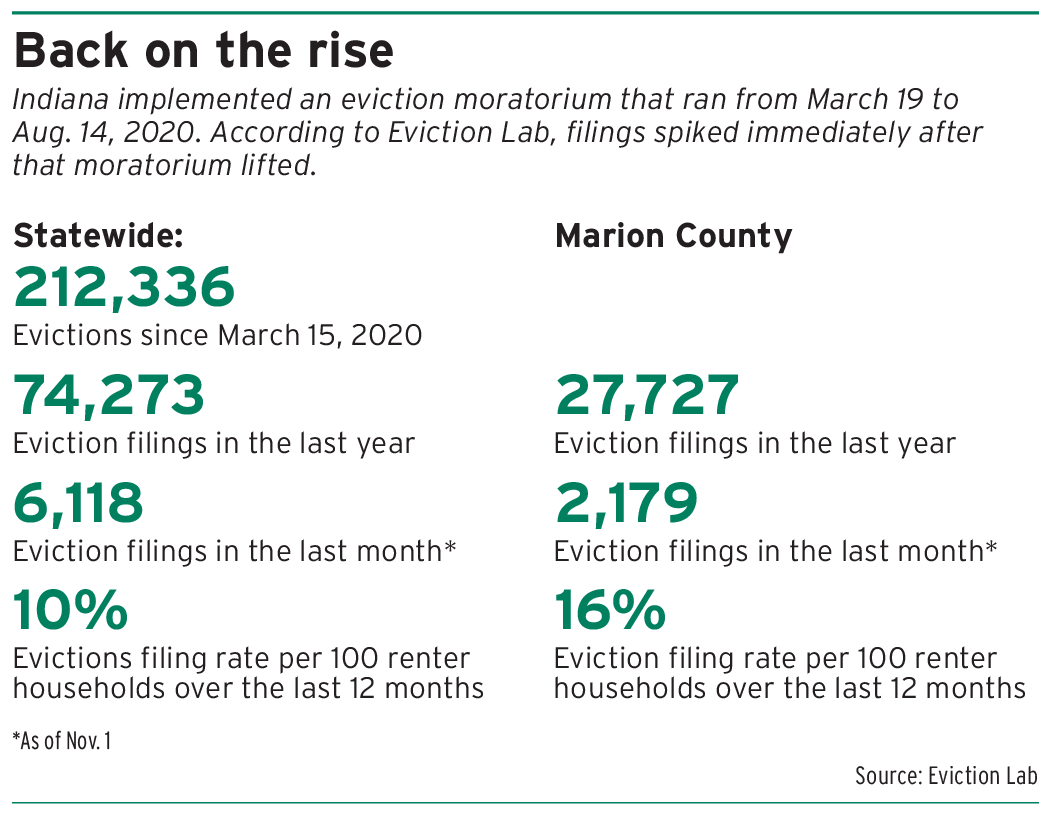
The state implemented an eviction moratorium that ran from March 19 to Aug. 14, 2020. Filings spiked immediately after that moratorium lifted.
As of Nov. 1, Eviction Lab reported there had been 212,336 eviction filings in the state since March 15, 2020, and 74,273 filings in the past year.
Bradley said the SAVI dashboard will help people take a closer look at eviction hot spots in Indiana, and at whether certain properties and property owners are responsible for the majority of filings.
McAleavey said the Dec. 7 event will include a panel discussion, with experts in the eviction and housing circle serving as panelists to provide insight and perspective.
He said event organizers will walk through the dashboard and its data, then open things up to the panel discussion.•
Please enable JavaScript to view this content.